Welcome to AGCHEQ Document Center
For further information: Connect@AGCHEQ.com
Improving West Coast Food Prices Will Impact Restaurant Earnings
June 23, 2016Investors have traditionally been unable to precisely quantify the impacts of macro factors, such as the persistent California Drought, on local food prices impacts until after their restaurant stocks publish their 10-Q Quarterly Earnings Release.
Almost half the publicly traded restaurants operate regionally and their Food Costs represent approximately 30% of expenses. Overall fresh food prices vary dramatically between markets making it is critical for food costs to track prices as accurately and as locally as possible.
This is especially important for the public restaurant groups that operate exclusively in regional markets such as:
- Bob Evans (NASDAQ:BOBE) - Eastern & Central
- Carrabba's Italian Grill (NASDAQ:BLMN) - Eastern
- Chuy's Holdings (NASDAQ:CHUY) - Eastern & Central
- Cracker Barrel (NASDAQ:CBRL) - Eastern & Central
- Habit Restaurants (NASDAQ:HABT) - Eastern & Western
- Jack In The Box (NASDAQ:JACK) - Western & Central
- El Pollo Loco (NASDAQ:LOCO) - Western
- Noodles & Co (NASDAQ:NDLS) - Western & Eastern
- Potbelly (NASDAQ:PBPB) - Eastern & Central
- Shake Shack (NYSE:SHAK) - Eastern
- Fiesta Restaurant Group (NASDAQ:FRGI) - Southern
- Zoe's Kitchen (NYSE:ZOES) - Southern & Eastern
Quantifying Individual Food Cost Shifts
Understanding real-time market prices for every critical item and the historical basis spreads between markets is critical to effectively managing risk and determining where to find relative outperformance.
Investors need to be able to compare the wholesale prices of goods not just in regions but in specific cities such as New York vs. LA, Chicago vs. Dallas, Boston vs. Miami and so forth.
Now, food market data is showing that after years of compression in large part because of the drought, prices spreads between Los Angeles and New York are returning. Restaurants operating in the West Coast are regaining their competitive advantage vs. their East Coast competitors.
West Coast menu prices were forced to rise in response to the input price spikes in last year's drought. However this recent drop in crucial input costs should improve gross margins and fall straight to the bottom line.
Likewise, lower prices for fresh foods at the West Coast grocery stores are also positively impacting the consumer's wallets, enabling greater spending on food away from home category.
When it comes to the stocks above, look for relative outperformance in companies that are based in or generally operate the West Coast such as Jack In The Box, El Pollo Loco and The Habit Restaurants.
As the sheer complexity of the food system prevents most investors having accurate insights into input costs are at such a granular level, it is possible that East Coast firms not benefiting from this price shift will report weaker than expected earnings on a relative basis. This is a specific negative element for companies such as Bob Evans Farms, Bloomin' Brands, Chuy's Holdings, Cracker Barrel Old Country Store, Potbelly Corp., Shake Shack and Zoe's Kitchen that creates the risk of underperformance.
Comparing Food Costs Changes: Los Angeles vs. New York
This is where specialized food market data services like AGCHEQ add value by offering accurate visibility into the food costs of every restaurant group.
AGCHEQ Meat, Poultry, Fruit and Vegetable Indices aggregate market data from 27 major markets into indexes on the leading 60 major commodities (composed of 4700,000+ unique fresh food products). Daily wholesale market updates offer precise transparency into price changes and trends of the most important inputs.
When doing so, accurate volume weighted average price indexes is far and away the most accurate method of gauging food prices in a market that has more 4,000 unique package variations and a further 100 times more unique products.
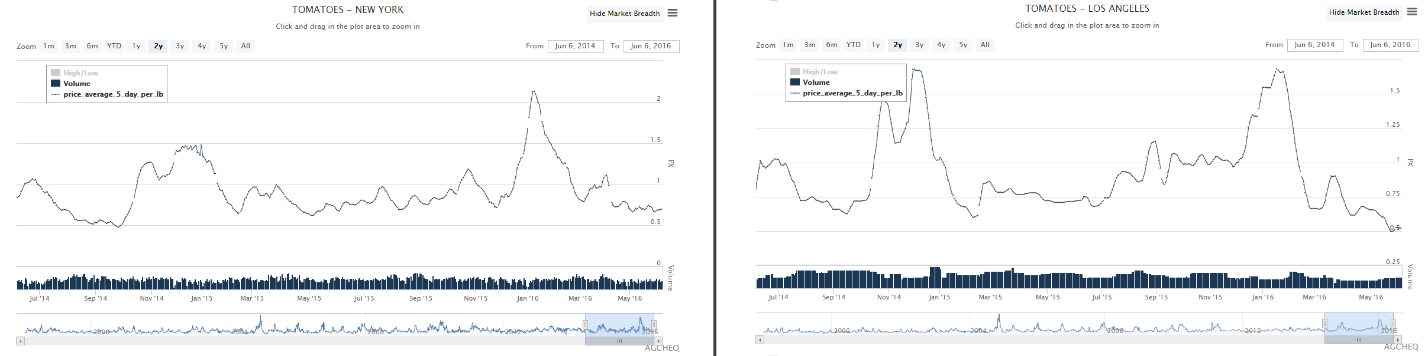
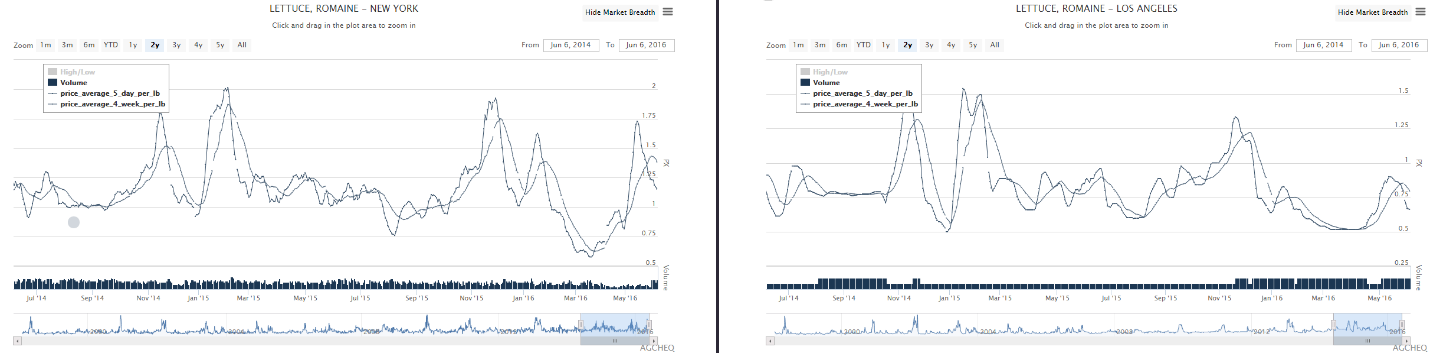
Comparing select AGCHEQ Vegetable Price Indexes between Los Angeles and New York over the last 5 years shows the huge, volatile price spreads and demonstrates the importance of accurate food cost visibility on a local level.
Most importantly for investors, these indexes show precisely how wholesale prices spreads on a number of important items are improving again. Prices in Los Angeles were rising faster than prices in New York for several years are improving once again, the competitive advantage is returning.
- AGCHEQ Tomato New York Index (TOM.NY) traded 11.7% higher than AGCHEQ Tomato Los Angeles Index (TOM.LA) over the last 5 years. This spread went down to just 0.4% over the last 2 years (below) but has since returned to +21.1% over the last 3 months.
- AGCHEQ Romaine Lettuce New York Index (LTR.NY) traded 49.1% higher than AGCHEQ Romaine Lettuce Los Angeles (LTR.LA) for five years. This spread dropped to 39.9% over the last 2 years (below) but in the last 3 months has shot back to 57.2%.
At its peak, the prices of Avocados where even higher in L.A. than in New York - now they are back to being 20.9% cheaper.
The return of this historic price spread is occurring across the spectrum and is even more dramatic in the important Fruit markets.
Given non-perishable food prices remain very stable across markets (not much arbitrage opportunity for Ketchup or Bread), fresh food prices like produce impact company costs far more than expected.
These examples underscore the double-digit price spreads between markets determined by the unique characteristics of every individual fresh commodity.
With tools such as the AGCHEQ Indexes, investors can quantify the impact of macro factors such as the California drought in real-time.
For chains based in the West Coast, this recently lost competitive advantage is returning and now it is possible to precisely measure, before earnings, just how quickly that is happening.
Disclosure: I/we have no positions in any stocks mentioned, and no plans to initiate any positions within the next 72 hours.
I wrote this article myself, and it expresses my own opinions. I am not receiving compensation for it. I have no business relationship with any company whose stock is mentioned in this article.
Additional disclosure: Copyright 2016 AGCHEQ Inc All rights reserved. AGCHEQ is a registered trademark of AGCHEQ Inc. AGHCEQ makes no representation or warranty, express or implied, as to the ability of any index to accurately represent the asset class, company cost index or sector it purports to represent and AGCHEQ shall have no liability for any errors, omissions, or interruptions of any product, index or the data included therein. Past performance of a product or index is not an indication of future results. This document does not constitute an offer of any services. All information provided by AGCHEQ is general in nature and not tailored to the needs of any person, entity or group of persons. AGCHEQ is not an investment advisor and makes no representation regarding the advisability of investing in any such investment fund or other investment vehicle. For more information, please visit www.AGCHEQ.com
Source: SeekingAlpha.com